Trend Calculation Report
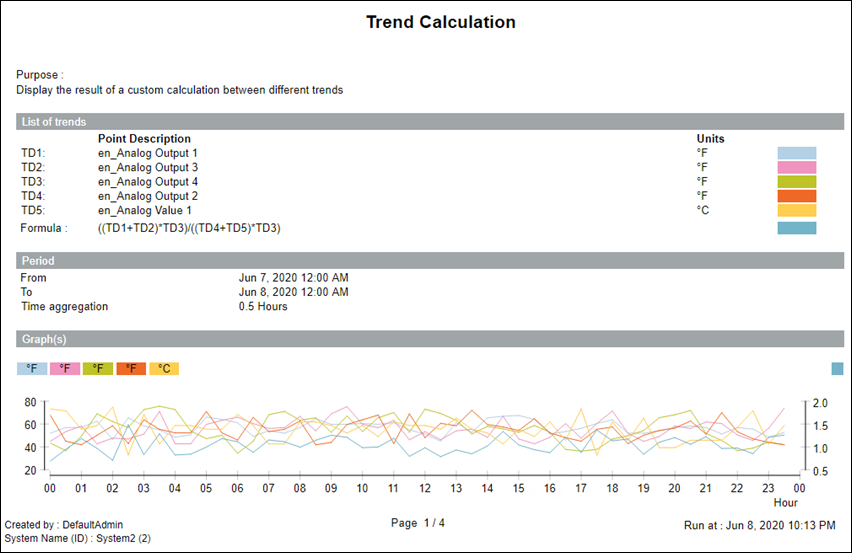
This report is designed to display a chart or table or trend data for a maximum of 5 different trend log objects, and also displays result of a custom calculation between them. The report can be adjusted with different values to be specified in the Parameter dialog box, to allow the most frequent report content.
Sample report
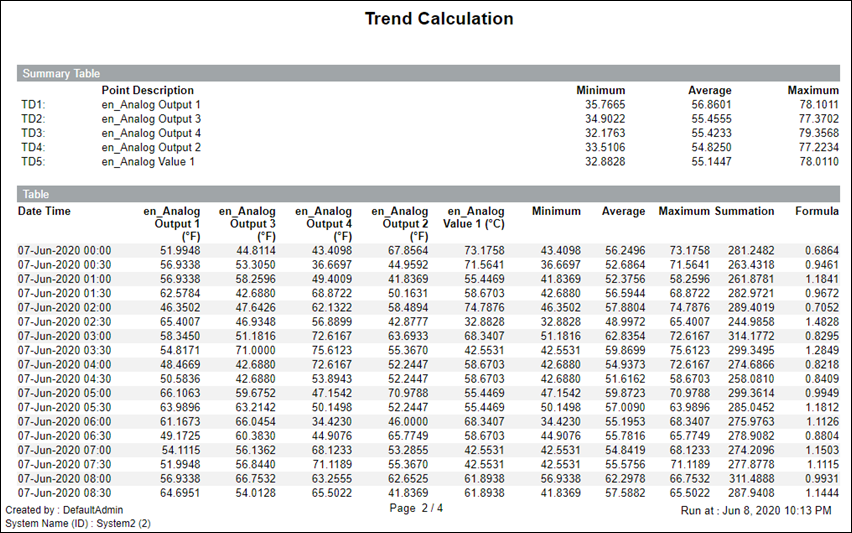
Indicator | Description for Table |
Asterisk - Red | Aggregation was not possible for the interval, so the last known aggregation is displayed. |